Feedback tool for Product Teams
NPS is a lagging indicator,
PMF is the leading one
NPS score tells you what happened. PMF score tells you what's coming.
Together, they reveal exactly which users to prioritize and which feedback to ignore
No credit card required
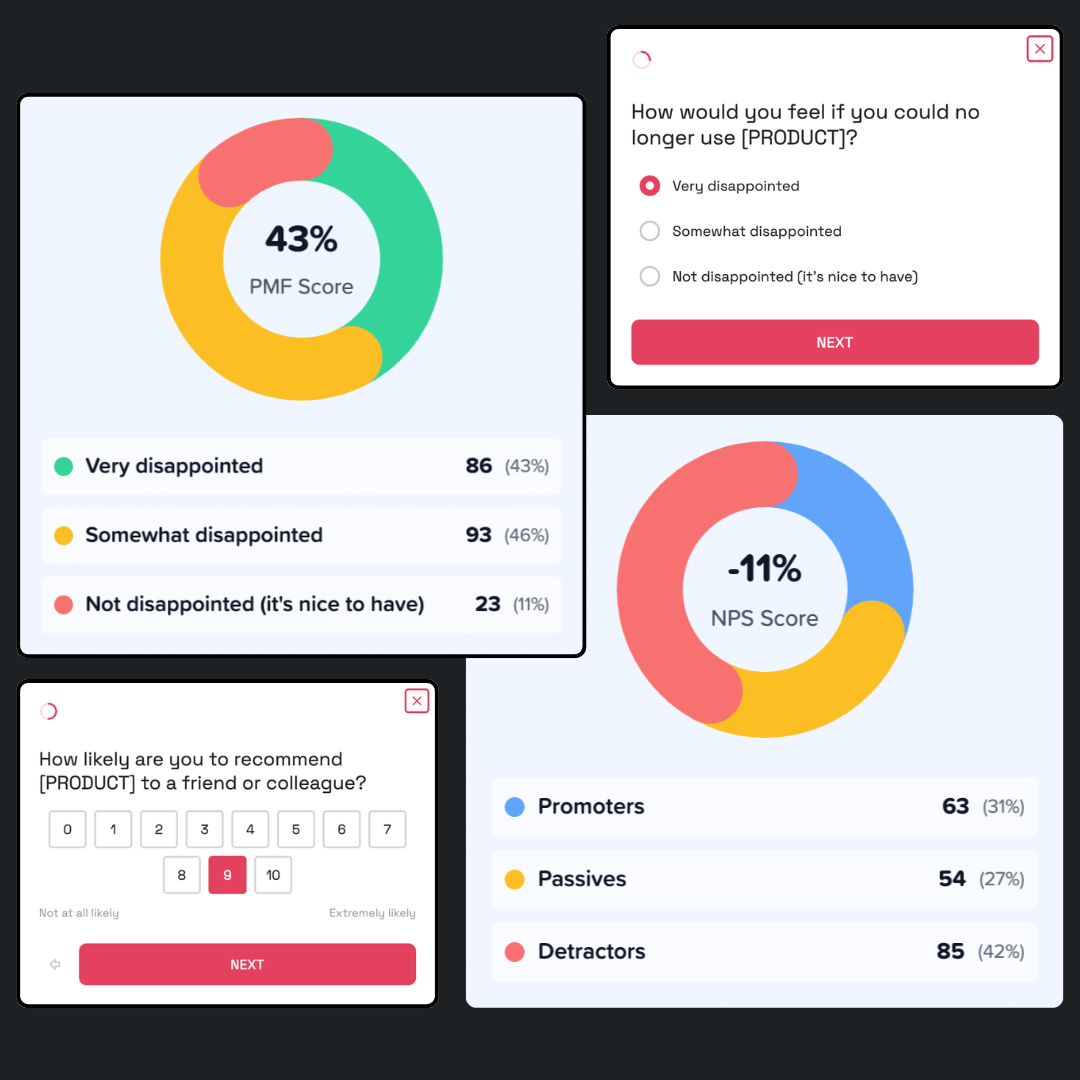
Try a NPS + PMF survey template
See how running both questions together gives you way more insights than just NPS alone

See PMF and NPS Scores with context
Other tools
"100 users are happy, 40 are unhappy."
Mapster Surveys
100 happy users · pro plan users · from USA · "love onboarding"
40 unhappy users · free plan users · from EU · "frustrated by pricing"
See which users gave what score, from where

NPS alone won't cut it,
PMF is the real indicator
NPS was built for enterprises measuring brand loyalty at scale. Startups need to answer a different question: do people actually need this?
NPS ALONE
"Would you recommend us?"
Measures loyalty and brand perception
Designed for enterprises with large customer bases
High NPS ≠ product people actually need
Users can score 9/10 and still churn
No signal on product-market fit
Best for: Enterprises tracking brand loyalty
PMF SCORE
"How disappointed would you be?"
Measures if people actually need your product
The #1 metric for early-stage startups
40%+ "very disappointed" = you have fit
Tells you exactly which users to double down on
Segment by cohort to find where fit is strongest
Built for: Startups finding product-market fit
A high NPS means people like you. A high PMF score means people can't live without you. That's why smart teams run both.
NPS + PMF Segmentation
Running both questions in the same survey takes 30 seconds for users. But now you can cross-reference responses to unlock insights neither metric provides alone.
These users would recommend you AND would be devastated without you.
✓ Action: Study them deeply. What do they have in common? Build your ICP around them.
They like you and would recommend you, but could easily switch to a competitor.
⚠ Action: Understand what's missing. They're one feature away from being champions.
They can't live without you, but they're frustrated. They won't recommend you (yet).
🔥 Action: Fix their pain points FAST. These are your most valuable users to retain.
They're not engaged and wouldn't miss you. That's okay - they're probably not your ICP.
→ Action: Don't build for them. Focus on segments with high PMF potential.
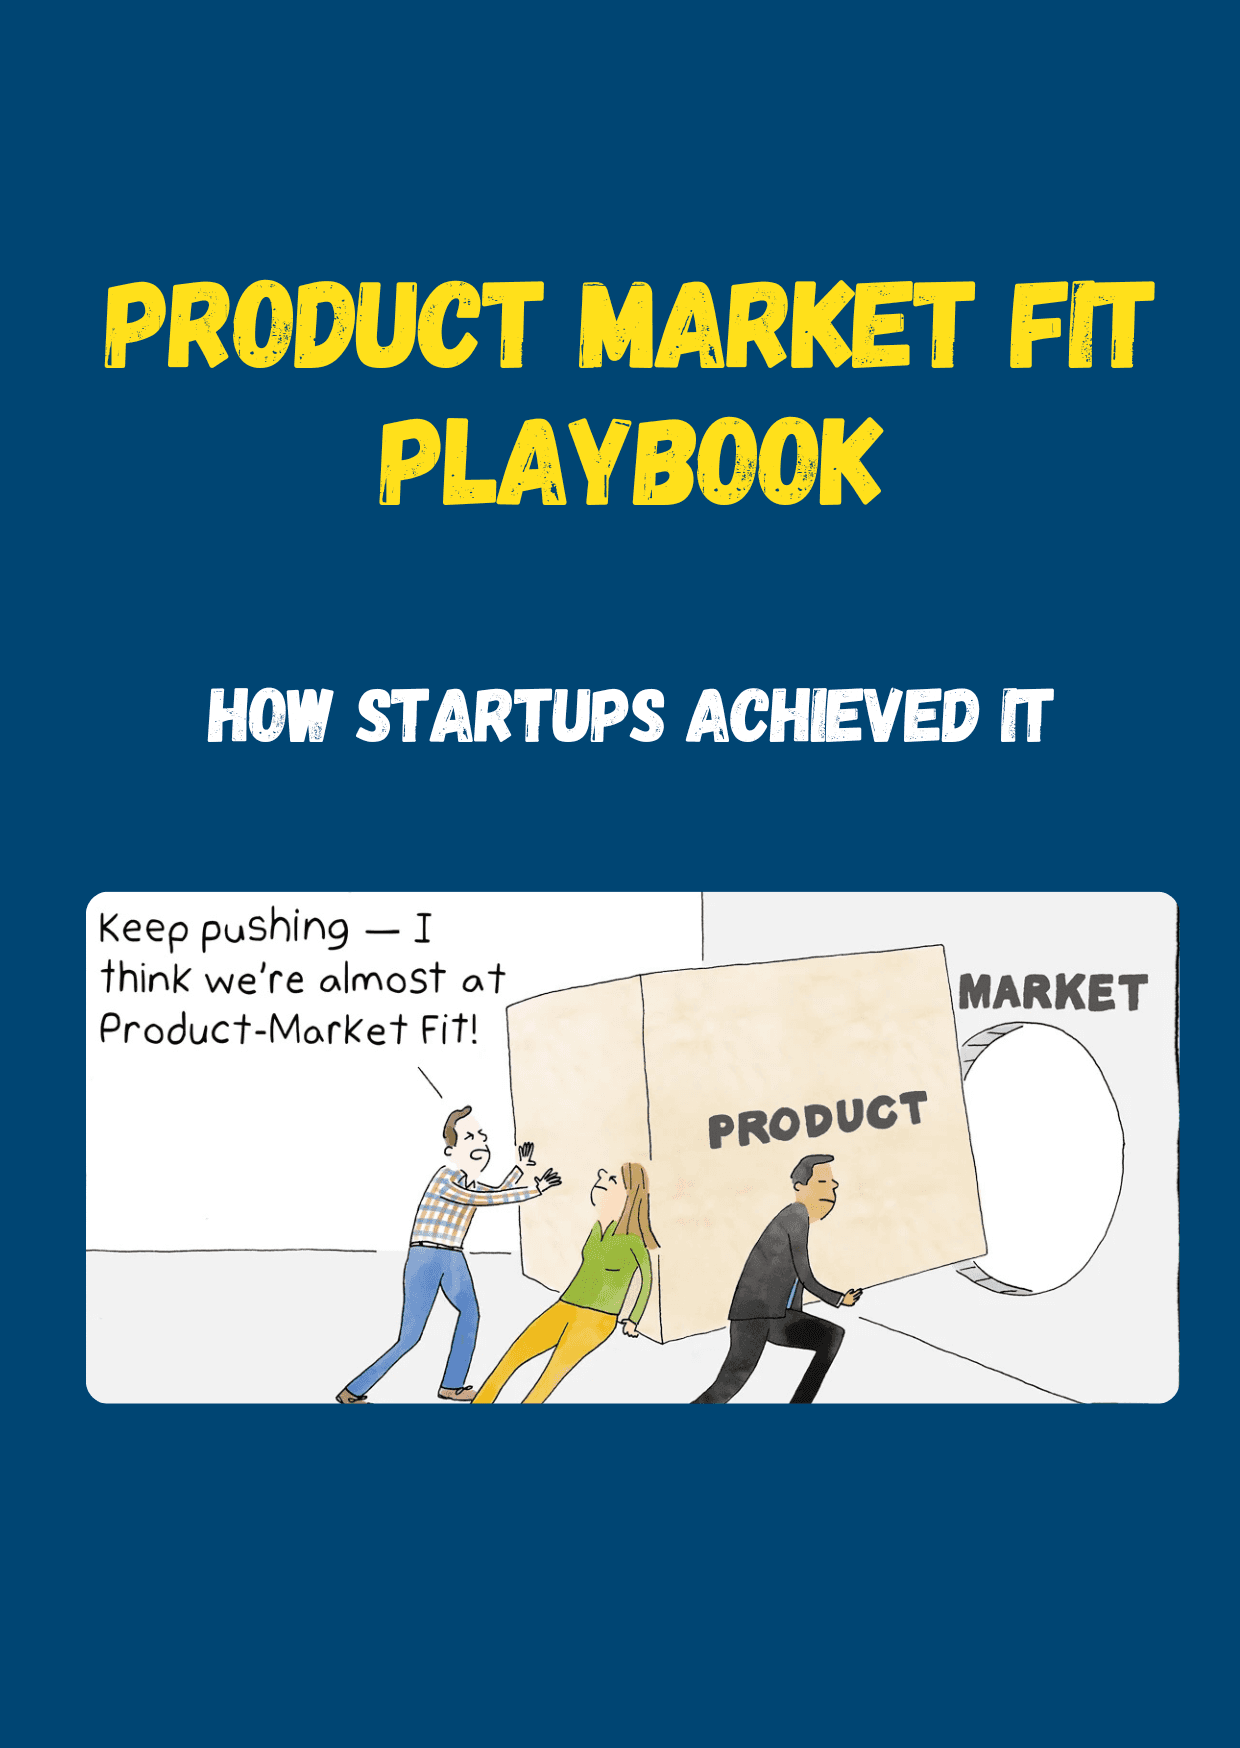
Product Market Fit Playbook
This Playbook will explain you the concept, how to measure it and the exact strategies used by Slack, Intercom, AirBnB, and more, to achieve it.
42%of startup failures are due to poor Product Market Fit, measure yours.
NPS is Powerful, But It's Not the Full Picture
NPS tells you if customers will recommend you. But it doesn't tell you if your product is essential to them.
High NPS ≠ Product Market Fit
Users might recommend you because you're "nice to have", but would they be devastated if you disappeared?
Different Questions, Different Insights
NPS asks "will you recommend?" PMF Score asks "how disappointed would you be without us?", a much deeper signal.
Best Results Together
Running both surveys gives you a complete picture: loyalty (NPS) + product essentialness (PMF Score).
NPS vs PMF Score
Both are valuable metrics, but they measure fundamentally different things. Here's why you need both.
NPS (Net Promoter Score)
Measures satisfaction and advocacy (Lagging indicator)
The question:
"How likely are you to recommend our product to a friend or colleague?"
What it measures
Satisfaction, loyalty, and willingness to advocate
Best for
Tracking customer satisfaction over time, predicting word-of-mouth growth
The limitation
Users can be satisfied but not dependent. High NPS doesn't always mean you have product market fit.
"I'd recommend it to others, but I wouldn't miss it if it disappeared."
→ This is what NPS can miss
PMF Score
Measures genuine need and dependency (Leading indicator)
The question:
"How would you feel if you could no longer use our product?"
What it measures
True product market fit, whether users are dependent on your product
Best for
Pre-PMF startups validating product necessity, finding must-have user segments
The advantage
Leading indicator that predicts growth. Get actionable data in 30 days vs 6-12 months for retention metrics.
"I'd be very disappointed without it. It solves a critical problem for me."
→ This is genuine product market fit
Key Differences
| NPS | PMF Score | |
|---|---|---|
| What it asks | "Would you recommend?" | "Would you be disappointed?" |
| Measures | Satisfaction & advocacy | Genuine need & dependency |
| Indicator type | Lagging indicator | Leading indicator ✓ |
| Time to insights | Ongoing tracking | 7 days ✓ |
| Best stage | Post-PMF growth | Pre-PMF validation ✓ |
| Threshold | 50+ is "excellent" | 40%+ = PMF achieved ✓ |
The Bottom Line
NPS measures satisfaction. It's great for tracking how happy customers are and predicting word-of-mouth growth. But satisfied customers don't always stick around.
PMF Score measures need. It tells you if users are truly dependent on your product, the foundation for retention and sustainable growth.
Use PMF Score to figure out WHY you do or don't have product market fit, then use NPS to track satisfaction as you scale.
Go Beyond Just NPS Understand Product Market Fit Too
Every response linked to the real user who gave it. Segment by plan, role, or cohort. Know exactly which users are champions, at-risk, or not your ICP.
Try a NPS + PMF surveyNo credit card required